


Introduction
Infographic Marketing is a secret weapon for transforming dull data and making it communicative, bite-sized visuals. Whether you’re instructing your readers or selling a good infographic can take your instruction or sales pitch to a new level. While all images are created differently, knowing the various types of infographics and how to use them makes all the difference in a campaign’s success.
From data-presenting statistical infographics to productivity-boosting charts that explain processes, there’s a reason for each of them in your content arsenal. Would you like to know what an infographic is and how to actually use it? These images help end-users and boost SEO by encouraging shares and backlinks.
With some clever infographic design techniques, you can multiply the return on your content marketing and produce the best infographics that inform, engage, and persuade.
In this blog, we’ll break down the most effective infographic layouts and precisely when to use them to maximize your content campaign and see results.
Statistical Infographics- For Presenting Data with Impact In Infographic Marketing
Among all infographic marketing formats, statistical infographics have no match in their influence power. These transform data into persuasive visuals that are not only understandable but also highly compelling. If you’re looking to demonstrate authority, reveal trends, or establish believability through numbers, this type of graphical content offers unmatched clarity.
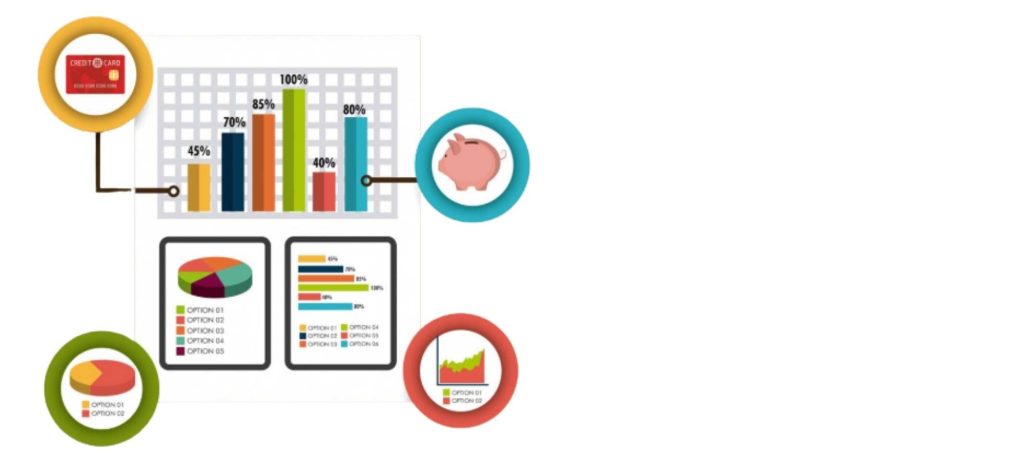
Why Statistical Infographics Matter for Infographic Marketing:
Statistical infographics bridge the gap by allowing brands to cut through information noise and communicate concise, revealing information that lingers. Statistical infographics are standout performers, especially in campaigns involving visual content marketing in which hard data needs to be communicated quickly and persuasively.
Main Advantages:
- Assist in condensing massive datasets.
- Offer evidence to reinforce narration.
- Increase credibility by using visual proof.
- Increase content shares and backlinks, preferring infographics and SEO.
When to Use Statistical Infographics:
- Annual reports contain the company’s performance indicators.
- Market research or audience response data from surveys.
- Industry trends, predictions, or market data reports.
- Whitepapers and case studies that need images as evidence.
Also Read: SEO Services Canberra
Informational Infographic- For Explaining Concepts Clearly In Infographic Marketing
Among all varieties of infographics, informational infographics are applied most often in infographic marketing. Their main goal is to dissect hard subjects and condense them into a consumable, easily digestible form. Informational infographics are created to inform, enlighten, and transmit a clear perspective of a subject.
If you’ve had an attempt at researching what on earth an infographic is, then this is likely to be the form you’ve read about. It consists of minimal text blocks alongside icons, images, and basic layouts—perfect for condensing abstract or technical information into plain narratives.
When to Use Informational Infographics in Infographic Marketing:
These infographics are incredibly versatile. You can use them when you want to:
• Discuss a product or a service.
• Break down industry-specific concepts.
• Abstract longer-form writing like whitepapers or blogs.
• Provide a step-by-step account.
• Let your listeners know of a problem and its solution.
For example, a digital firm can use an informative marketing infographic to outline how their SEO process works or what goes into a social campaign.
Including information infographics in your infographic marketing strategy is a genius move for any business that aspires to explain, educate, and delight. These infographics convert muddled communications into graphical narratives, boosting understanding and eliciting action. When designed strategically, these are priceless supplements to your entire visual content marketing campaign.
Timeline Infographics – For Showing History or Progress in Infographic Marketing
Of infographic marketing strategies, timeline infographics are best for their distinctiveness in displaying things like events, milestones, or procedures in a stream of chronological progression. These work best when you’d like to demonstrate a journey of sorts to your viewers—be it a timeline of how your brand progressed, a lesson in history, or a plan of work on a project.
Among all infographic varieties, timeline designs are systematic and chronological and can simplify complex stories into basic ones. If you have been wondering what infographic is good for telling a story from start to finish, then timeline infographics are your solution.

When to Use Timeline Infographics in Infographic Marketing:
Timeline infographics work best when time and order are key. These are the best use cases:
• Company Milestones: Emphasize your growth and development years.
• Product Development Roadmaps: Outline steps from concept to launch.
• Event Promotions: Emphasize timetables and schedules for more interaction.
• Historical Overviews: Offer a timeline of a concept, trend, or industry.
• Step-by-Step Processes: Guide users through a workflow in a graphic manner.
For instance, a timeline-style marketing infographic can easily depict a yearly campaign plan, a month’s editorial calendar, or significant marketing achievements.
It is one of infographic marketing’s strongest contenders as a type of organized narration. These highlight development in terms of time and deliver context and clarity. These infographics can have great outcomes in your visual content marketing plan, and they can transform your history, process, or plan into a persuasive story graphically.
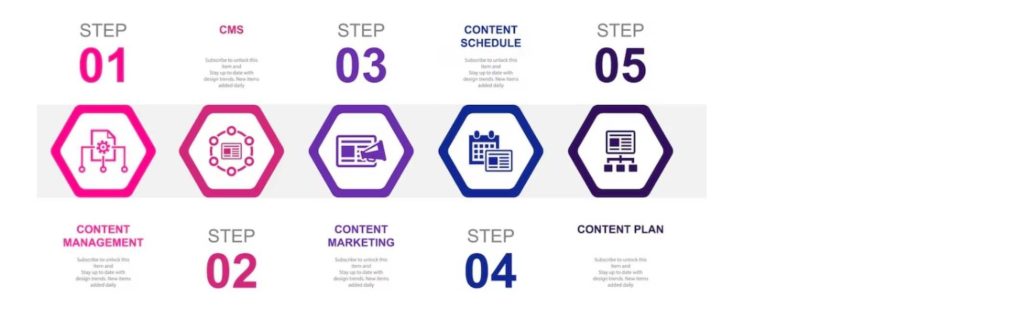
Process Infographics- For Step-Based and How-To Content in Infographic Marketing
For infographic marketing, you’re going to need to process infographics if you’re looking to effectively outline a set of steps. These images are perfect for guides, workflows, and tutorials because they organize information in a series of steps that can be followed by users.
Among all the types of infographics, process-based ones are best characterized by streamlining complex instruction and maximizing usability in content. Even after learning about what infographics are used in instruction or learning, this type offers the best clarity and directional pull.
When to Use Process Infographics for Infographic Marketing:
If your content involves step-by-step processes, such as:
• Tutorials: Sequential instructions on how to utilize a tool or service.
• Client Onboarding Journeys: Illustrate onboarding workflows graphically.
• Service Delivery Procedures: Explain how your product or service functions from start to finish.
• Internal Teams’ Workflows: HR, marketing, or sales processes.
• Training Materials: Guide users or staff through required actions.
For instance, a marketing infographic detailing the pipeline for content production (ideation to publication) works best in this format. Both for external marketing as well as internal guides, this format ensures clarity and succinctness in its delivery.
As you teach and guide your target market, you can’t do without process infographics as part of your infographic marketing arsenal. These enable you to make cognitively complex processes clear and boost engagement by offering clarity, structure, and aesthetic value. When well designed, these become a signature of high-performance visual content marketing.
Also Read: Automated Branding the Future of Marketing
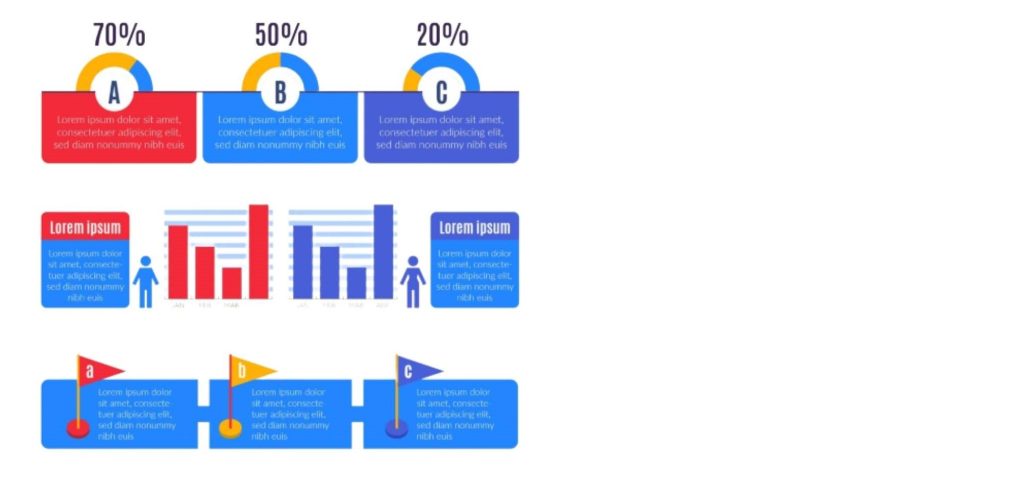
Comparison Infographics- For Presenting Differences and Decisions In Infographic Marketing
We rarely see a tool as persuasive as the comparison infographic. Comparison infographics help others make intelligent decisions by offering a comparison between two or several things—products, services, choices, or timelines. Comparison infographics are most effective when trying to minimize options, compare advantages, or show a difference between pros and cons.
If you’re still wondering what an infographic is, this format is a brilliant example of how visuals can make abstract comparisons into brief, scannable, and attention-getting content.
When to Use Comparison Infographics in Infographic Marketing:
Comparison infographics are perfect for any scenario in which users compare options. You can employ them in the following situations:
• Comparison of Products: Highlight variations in features, prices, and performance.
• Service Breakdowns: Help clients choose plans or products.
• Before vs. After Images: Illustrate effects of a product or service.
• Competitor’s Analysis: Look at how your brand stands out compared to others.
• Guides for Decision-Making: Help users make quick decisions.
For example, a marketing infographic entitled “Organic SEO vs. Paid Ads” can help clients decide which of these options best matches their goals.
Comparison infographics are a force to be reckoned with in infographic marketing because they allow viewers to see major distinctions at a glance. When well-designed, they sum up tough decisions and encourage increased interaction. For brands looking to build trust and boost conversions, this type of infographic is a strategic piece in any arsenal of visual content marketing.
Location-based Data: Geographic Infographics for Infographic Marketing
It is not just about design, it’s Infographic marketing that focuses on being relevant. And if your data is of a geographical kind, geographic infographics are the ideal type. Employing maps, regions, and place markers, these images represent place-based data in a form that allows observers to grasp regional trends, patterns, or possibilities at a glance.
When to Use Geographic Infographics in Infographic Marketing:
Use geographic infographics when the place is relevant. Ideal scenarios include:
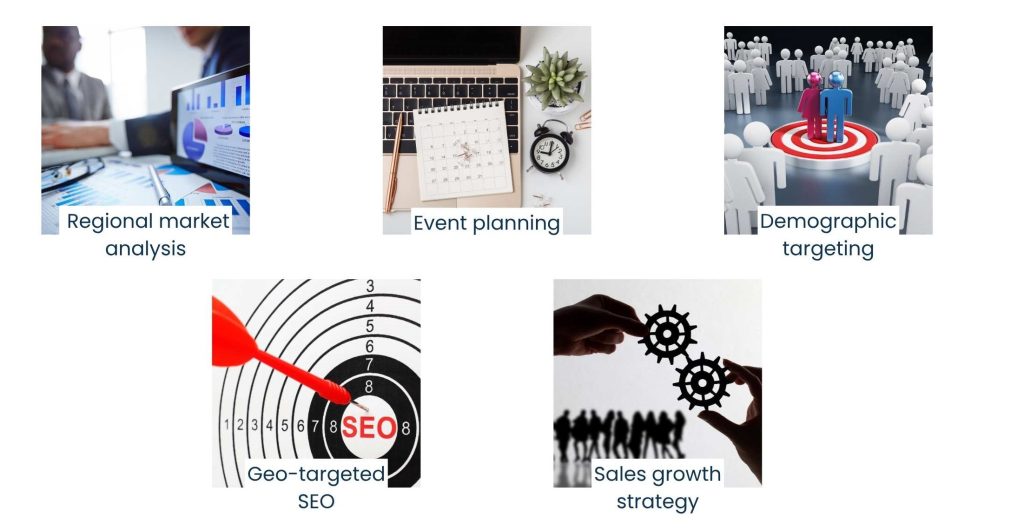
- Regional market analysis: Demonstrate how product adoption differs between states or cities.
- Event planning: Communicate where your conferences, meetups, or roadshows take place.
- Demographic targeting: Communicate with customer segments by region.
- Geo-targeted SEO: Display stats by location.
- Sales growth strategy: Identify where and how to grow, opportunities to expand, etc.
For instance, a marketing infographic showcasing the best-performing cities for ad campaigns can assist executives in making data-driven regional choices.
When data is location-based, geographic infographics become your favorite visual in infographic marketing. They personalize the narrative, provide decision support, and optimize for SEO by becoming local. They’re also one of the most informative and shareable types of visual content marketing out there.
List Infographics: Quick to Grasp and Manage the Content
The list is one of the friendliest reading formats known to readers in infographic marketing. Devoted to easy perusal and simple scanning, it involves information that looks like a number list, where you can see all points at once. When producing content for a fast-paced audience, list infographics are your close buddy.
One of the most popular kinds of infographics, lists can be particularly powerful when it comes to tips, how-tos, resources, and rundowns. When someone is made to want to know what an infographic is because they can consume long content only if it is conveniently broken into a few key points, a numbered paragraph approach is the answer.

When to Use List Infographics in Infographic Marketing:
Use list infographics when you’re looking to give categorized or grouped information, such as:
For example, Tips and best practices – “10 Social Media Marketing Tips for Startups. Step-by-step guides – Divided into a numbered process.
- To-Lists: Overlays with task-oriented and -based visuals for the user to follow.
- Stuff: Best Tools/Resources/Platforms Suggestions.
- Spotlight summaries: Standout features in a product or service.
These are perfect for sharing in a marketing infographic series on your blog, social media, or email newsletters.
List infographics are one of the most popular infographic marketing examples to convey simple, organized, and engaging information. They make brands pop, prompt shares, and enhance SEO; all main objectives of any strong visual content marketing plan.
Interactive Infographics- For Engaging the Reader
In the changing landscape of infographic marketing, the “poster advertising of the internet,” brands are now stretching past mere posters to form content that feels like an experience. Let us introduce the interactive infographic, a digital presentation that the user can explore, click, scroll, or hover to see more information. Unlike regular infographics, interactivity increases user engagement because it makes the viewer go from idle observer to active participant.
Interactive infographics are the most sophisticated and flexible forms of infographics among all the updated forms. For those who are wondering, what’s an infographic that can provide more engagement and information on long lists without mentally exhausting you? This format is the answer.

When to Use Interactive Infographics in Infographic Marketing:
This is a good opportunity for you to use interactive infographics if your content is complex, multi-layered, or has a lot of information. Ideal use cases include:
- Data dashboards: Allow your users to filter or self-explore your data in real-time
- Product comparison utilities: Enable next to each other feature analysis
- Quizzes and exams: Allow learners to answer questions and get visual feedback
- How to steps: Click-thru or decision-based options
- Explainer: An interactive story/timeline with embedded visuals
SaaS, fintech, edtech, and healthcare all to great effect, where there are ‘layers’ of information establishing best practices.
The best marketing infographics of the future are interactive infographics. How? Mixing data, design, and user experience to provide personalized and dynamic content that users can´t get enough of. For brands that want to kick their visual content marketing up a notch and stand out in search results with an SEO advantage, nothing packs more punch on a page.
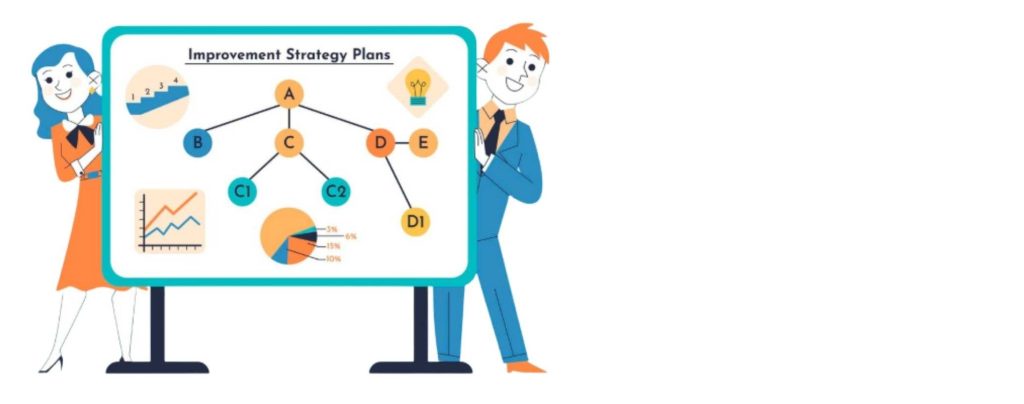
Articles in this section introduce the theme of hierarchical infographics and demonstrate its use for structured and tiered data.
In infographic marketing, format counts – particularly if you’re trying to present layered or ranked data. That’s where you get hierarchical infographics. These representations show how content relates to hierarchy, importance, authority, or sequence. They are great for teaching users how information relates together in an organized fashion.
This type of infographic is best when you need to create illustrations of hierarchies, networks, and the flow of command. If somebody asks you the value of an infographic that says, “order and structure,” this is the one you should respond with.
When to Use Hierarchical Infographics for Infographic Marketing:
- Organizational charts: Demonstrate company roles /your chain of command.
- Business model: Report strategic architecture or the process of more detailed, simpler process plans
- Sales funnels: Display the process from lead generation to close
- Pyramid-based theories: Maslow’s hierarchy of needs, or SEO importance levels
- Workflow levels: show permission levels or a multi-step approach
A fantastic marketing infographic based on this style would be a funnel chart of the various steps of lead nurturing.
They help realize structured systems in digestible layers. Hierarchies as infographics are a powerful format for including in your infographics marketing. Whether you’re depicting a workflow, a plan, or an org chart, this visual style is sure to improve clarity, which is essential for perspective and comprehension — critical ingredients for effective visual content marketing.
Also Read: Google Shopping Management Services
Which type of infographic is right for you While doing Infographic Marketing?
Choosing the right type is an essential part of an infographic marketing plan. Not all infographics are universally useful. Selecting the right kind means that your message is listened to, it is recollected, and it is acted on.

To help you make the answer, start by asking yourself a few key questions in Infographic Marketing:
- What’s the goal? Are you instructing your readers, convincing them, or are you explaining how to do something complicated?
- Who is your audience? Are they novices, experts, prospective clients, or business associates?
- What do you want them to do? Do they need to purchase, share, subscribe to, or simply get something in common?
- Is there a way to visualize the information? If so, which layout (timeline, comparison, list, etc.) is most useful?
By establishing your business objective, audience, and type of content, you’ll more easily pair your message to the most suitable marketing infographic format.
For example:
- Post a list of infographics to share short tips or tools.
- Consider a comparison infographic to aid in comparing options.
- Select a process infographic template to walk them through the steps.
- If you have data (or survey results) to show a statistical infographic is perfect.
The aesthetics come into play, too. Great visual assets, brand standards, and good layout mean the information in your infographic is useful and also visually appealing. That’s where some infographic design best practices come in handy.
In the end, the right infographic adds to the effectiveness of your content and furthers your infographics and SEO objectives. It is a backlink machine. It increases engagement and gets your content seen. Are you ready to have a more effective visual content marketing strategy?
Conclusion
In an age of information overload, infographic marketing provides a compelling resource to convey complex information rapidly, efficiently, and visually. Whether you’re explaining a process, introducing data, comparing options, or walking through a decision, there’s a graphic format among the many types of infographics to create to communicate in the most useful way.
Every type of infographic plays a distinct role — from list infographics with quick, easy-to-read facts to interactive infographics that require deep user engagement. You need the right format for the content you want to produce, one that falls in line with your goals, and expectations from your audience.
Don’t forget that having a good visual strategy relies not just on the topic, but also on great design. With these smart infographic design tips, you guarantee that your content stays understandable and warrants attention.
Consistent and compelling. Beyond that, used well, infographics will stimulate your shares, traffic, and backlinks to SEO through infographics, if done right. They can increase your visibility.
At its most effective, visual content marketing is more than just a pretty picture; it allows brands to drive tangible business results. Picking the right infographic, at the right time, for the right audience is what turns it from a good idea into the best infographic campaign.
About Us
Tasks Expert offers top-tier virtual assistant services from highly skilled professionals based in India. Our VAs handle a wide range of tasks, from part time personal assistant to specialized services like remote it support services, professional bookkeeping service etc. Furthermore, it helps businesses worldwide streamline operations and boost productivity.
Ready to elevate your business? Book a Call and let Tasks Expert take care of the rest.

About Author

Gary Katz
Related Blogs