


Introduction
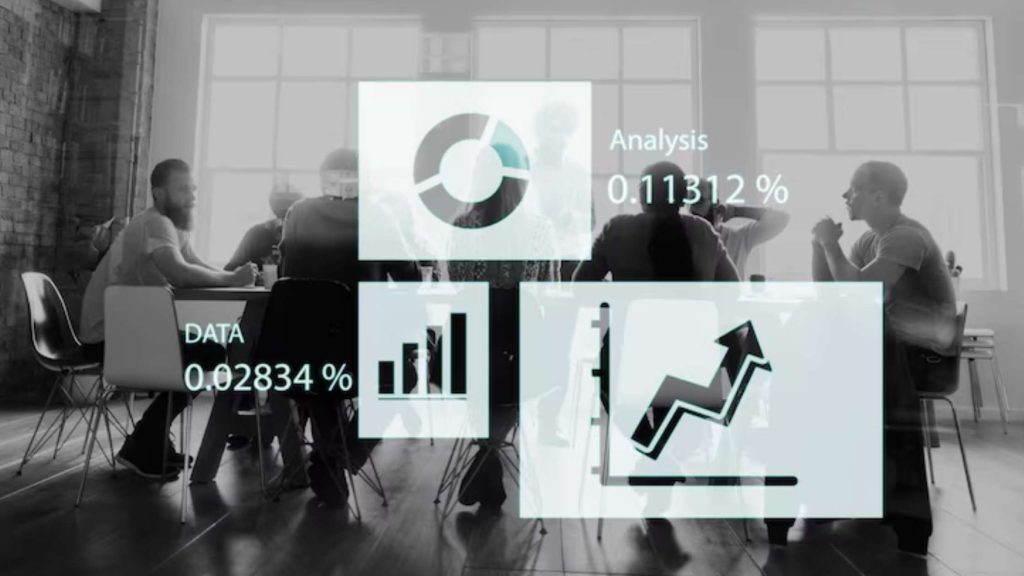
With Data all around, every interaction-click, sale, feedback, or website visit generates valuable information. Every transaction, customer interaction, website visit, and social click generates a new data point. But having lots of data isn’t the same as understanding it.
In fact, for many companies, raw data is more overwhelming than useful. That’s where data visualization consulting makes a significant impact.
Instead of sifting through endless spreadsheets or dense reports, business leaders can turn to visuals, charts, dashboards, and graphs to instantly spot trends, measure performance, and make smart decisions. A well-designed visualization brings clarity and helps teams take action with confidence.
Data visualization consultants specialize in turning large, messy datasets into clear, insightful visuals tailored to a company’s goals. Whether you’re a startup founder, a seasoned executive, or managing a growing team, these services can help you see what matters and use it to drive your business forward.
What Is Data Visualization Consulting?
Data visualization consulting is an expertise that helps businesses understand and use their data better by converting it into visual representations. Those visuals, charts, graphs, dashboards, heat maps, and various interactive tools take vast amounts of data and transform it into clear, simple, and usable insights.
Why does this matter? It’s because raw data by itself is not particularly useful. A spreadsheet containing 10,000 rows of numbers could contain important answers, but few if any of us have the time or expertise to burrow through it. Even when companies have lots of data on sales, marketing, operations, and customer behavior, they frequently struggle to wring insight from it.
That is where data visualization consultants can help. These consultants combine technical expertise with practical business knowledge. They know how to use software such as Tableau, Power BI, or Looker. They use these tools to solve problems, answer important questions, and help teams make better decisions. Any good data visualization consultant will begin with your business.

They ask questions such as:
- What do you want to achieve?
- Who needs to use the data?
- What decisions do you hope to inform?
- Where does your data live?
Once they know what you need, they will audit your current places where you have data(where that’s a CRM system, Excel files, online tools, or databases), and check the quality, completeness, applicability, and value of the data. They then design visual solutions that fit into your team.
These visuals could include sales dashboards for management, marketing reports for the marketing team, or operation trackers for warehouse operatives. Notably, graph consulting isn’t only about making graphs pretty. It means to simplify the information, bringing users’ attention to what matters, and letting them access the knowledge in a lighthearted way, regardless of their technical background. It’s a way to decentralize data so anyone on the team can use, interpret, and access information to make decisions.
Training and Support:
One of the key features of these services is training and support. A lot of consultants don’t just make the visuals, they’ll teach your team how to read them, update them, and get the most out of them moving forward. So that your business can remain data-driven long after your consultant has left your account.
In other words, data visualization consulting connects the dots between data vs insight. It enables all, from junior members of staff to senior, to ‘know their numbers,’ take control of their performance, and feel empowered to make evidence-based decisions.
Also Read: Virtual Assistant Services in Tromsø
Why You Should Care About Visualizing Data?
In the fast-paced business world, every organization collects a vast amount of data: sales numbers, trends, forecasts, website traffic, website conversions, customer engagement, social media performance, and so much more. Although this data is highly informative, the vast majority of organizations find it challenging to leverage. Why? Because raw data, especially in spreadsheets or static reports, is tough to consume.
It’s difficult to analyze, and frequently ignored entirely. And that’s where the power of data visualization comes into play. When complex data is transformed into comprehensible visual displays, curves and charts, and maps, and the like, people can absorb information promptly and accurately. Instead of wading through layers of row after row of numbers, decision-makers can look at a well-crafted dashboard and see how the business is doing at a single glance.
Here’s why visualizing data has such an impact:
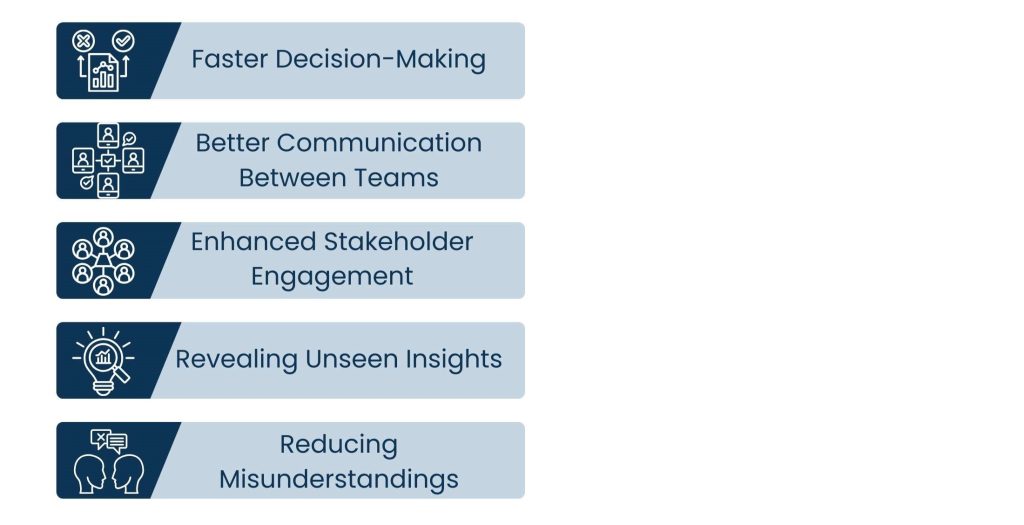
1. Faster Decision-Making
Visuals assist the leader in absorbing vast amounts of information at a glance. When time is of the essence, whether you’re responding to a decline in sales or changing your marketing plan, clear visuals support faster, smarter decisions. You don’t need to be a data analyst to observe what is working and what is not.
2. Better Communication Between Teams
When data is visual, we all speak the same language. A chart displaying monthly revenue or customer churn requires no explanation. This shared clarity promotes collaboration between departments (marketing, sales, operations, finance) and helps prevent people from going in different directions.
3. Enhanced Stakeholder Engagement
Interactive dashboards and cool visuals bring people in. In contrast to static reports, which are often unread, it is well-crafted visuals that grab attention and invite exploration. This ensures that the company’s internal owners and external investors remain invested in the success of the company.
4. Revealing Unseen Insights
A major benefit of visual data is identifying patterns. Patterns, outliers, or correlations that are hard to notice in raw data frequently become obvious in a graphic or heat map. That kind of information can translate into better product or service decisions, more informed budgeting and planning, or more efficient marketing.
5. Reducing Misunderstandings
Numbers can have a lot of interpretations. But with a good visual, there can be little doubt. Visually, the most critical data is emphasized in a clear format, and displays are all presented in a consistent, easy-to-understand presentation.
Finally, yet importantly, data visualization enables businesses to achieve more with the data that they already have. It allows access to the information, makes it more meaningful and more useful, and not only for analysts, but for managers, executives, frontline teams, and so on. In a data-first world, where data powers competition, being able to comprehend and act on it swiftly is a key leverage.
How Data Visualization Consultants Work?
Data visualization consultants often have a clear, step-by-step methodology to make sure the finished visuals reflect the goals of the business.
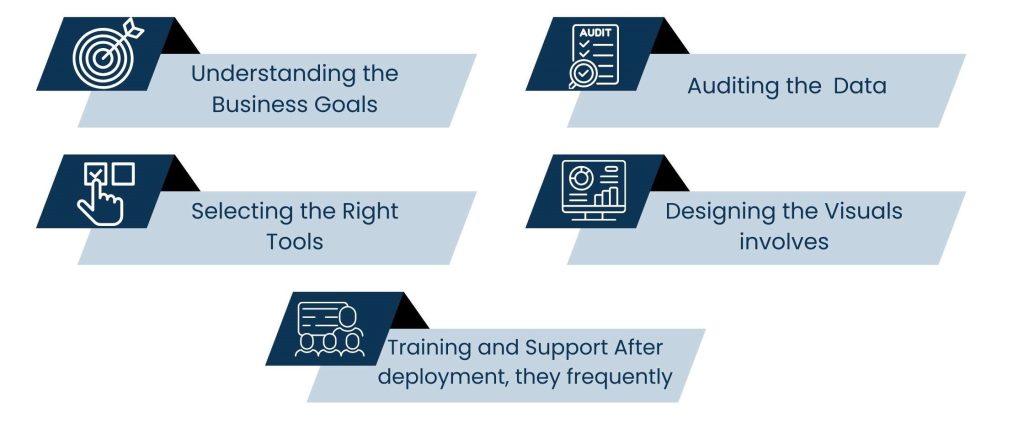
1. Understanding the Business Goals:
Before consultants touch any data, they ask questions like:
- What decisions are you trying to make?
- Who needs to view the data?
- What are your KPIs?
This step makes sure those visuals go beyond looking pretty, they are constructed to answer real business questions. Even the most beautiful dashboards can fail to hit the target if there aren’t clear goals.
2. Auditing the Data:
Consultants will evaluate your:
- CRMs, databases, spreadsheets, marketing, and finance tools
- Data quality, gaps, and integration problems
They’ll look at what data you have access to, where it resides, and how trustworthy it is. This stage helps prevent insight from being built upon incomplete data.
3. Selecting the Right Tools:
They select tools that suit your needs:
- Team’s level of expertise
- Tech infrastructure
- Size, scale, and scope of your business
Whether it’s Power BI, Tableau, or a homegrown tool, the best platform makes it easier for your team to work with and maintain the visuals over time.
4. Designing the Visuals involves:
- Creating easy-to-follow dashboards and reports
- Focusing on clarity, color usage, and layout
- Making sure the visuals point to the most important things
Consultants leverage design best practices to clean up the junk, direct attention, and make insights pop, so that users can act efficiently and securely.
5. Training and Support After deployment, they frequently:
- Train your team on how to use and update dashboards
- And provide ongoing coaching or become long-term partners
This means your team doesn’t just receive a tool; they know how to use it, and they keep getting value as your data changes over time.
The future of data visualization consulting
As organizations increasingly depend on data to inform intelligent, rapid decisions, the landscape of how meanings are represented in data is changing. Data visualization consulting is not so much about creating static dashboards, but designing tools and systems that are in line with how people work now. Here are some of the trends behind the new wave in data visualization.
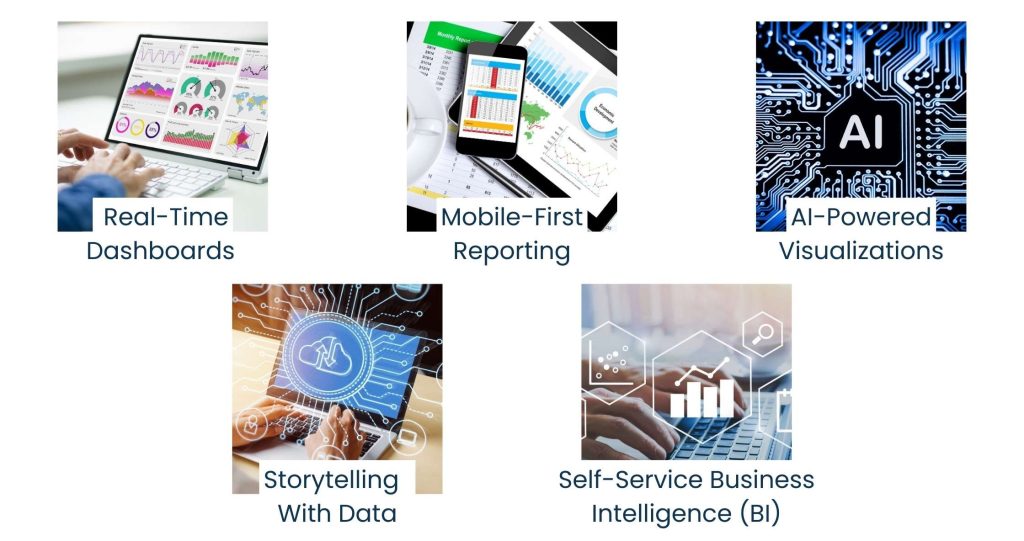
1. Real-Time Dashboards:
Businesses must make decisions promptly to act fast. It’s why real-time dashboards are the trend in today’s data strategies. These available dashboards integrate with your POS systems, CRMs, social media platforms, and websites and pull the current data into an updated report.
In other words, decision-makers aren’t processing yesterday’s numbers. For instance, a sales team can use it to track hourly performance, and a marketing team can live-track results of a campaign and adjust as necessary.
Data visualization consultants assist in designing these real-time systems so businesses can be flexible, as well as well informed, at any given moment.
2. Mobile-First Reporting:
More people are working remotely out of conventional office space. That is why mobile-friendly dashboards and reports are increasingly crucial. Consultants concentrate these days on creating pictures that are mobile-friendly and optimized for small screens.
Whether it’s an executive looking at KPIs from a smartphone or an on-the-ground manager monitoring operations on a tablet, the demand for clear data when you need it, where you need it, is rising, and consultants help to make sure it’s built in from the beginning.
3. AI-Powered Visualizations:
Artificial Intelligence (AI) is changing the way that we analyze and visualize data. With the use of AI in visualization, algorithms can automatically draw attention to inconsistencies and trends in the dataset where the human eye might overlook them. For example, AI can identify sudden changes in user behavior, alert about financial report risks, or forecast upcoming trends by analyzing past data.
Consultants leverage these capabilities to create more intelligent dashboards that do more than just present data; they also assist with their interpretation.
4. Storytelling With Data:
Facts don’t lead to action; stories do. This is why storytelling with data has moved to the top of our agenda on charts and data visualization consulting. Here, the idea is to design visuals in an intelligible order that can lead viewers to an understanding or decision. But rather than dumping a zillion disconnected charts on users, consultants built dashboards that showcased the most important data points, explained the meaning of those data points, and suggested what to do with them.
5. Self-Service Business Intelligence (BI):
Another huge trend is self-service BI, in which employees at all levels can access and explore data on their own without requiring any technical knowledge or IT assistance. The consultants create easy-to-use interfaces that users can click, filter, drill down, and report at the click of a few buttons. This enables teams to ask and answer their own data questions, resulting in faster insights and a more data-oriented culture across the company.
Conclusion: Making Decisions From the Data
Data without direction is simply noise. But with the correct visuals, even the most unstable data can become a powerful business tool. Data visualization consulting turns confusion into clarity and data into action. If you want to get the most out of the data you already have available to you, working with experienced data visualization consultants would be the best decision you’ve ever made.
At Tasks Expert, we have an interest in showing companies how they can harness the power of their data with expert analysis and clear, visual reporting. Feeling like you need some help making sense of your numbers? Contact Tasks Expert today to learn how we can help you turn your data into strategic insights.
About Us
Tasks Expert offers top-tier virtual assistant services from highly skilled professionals based in India. Our VAs handle a wide range of tasks, from part time personal assistant to specialized services like remote it support services, professional bookkeeping service etc. Furthermore, it helps businesses worldwide streamline operations and boost productivity.
Ready to elevate your business? Book a Call and let Tasks Expert take care of the rest.

About Author

Gary Katz
Related Blogs